Translate this page

Some beautiful music to read the blog with

Sunday 29 May 2016

Citadel effect on Salvage Material Prices

I noticed the below charts of certain Salvage Materials moving up off the dials recently (all charts are over a year):

Now, this is not the case for all Salvage Material items - hence i don't think this indicates a lack of supply (or activity from salvage) as a general theme though this perhaps plays a part.

. . . . . clearly, these are Citadel related materials where demand is noticeably outstripping supply.

Furthermore, i am thinking that the current war is diverting activity away from salvaging activity - hence, supply is perhaps unable to react in the short term.

I have not checked but i have to expect that the Planetary Equipment items that are required in Citadels are also moving upwards at the speed of light also - though it is easier for supply to react given these items can be produced when players are doing other things or indeed when offline.

Now, i suppose the question is whether these items are going to remain at a high level (i.e. Citadels will be built then destroyed and so built again as an ongoing cycle) or whether they fall back to prior levels.

Either way, for those players that like to salvage - there is a good market for some items at present!


Broken Drone Transceivers have gone up 5x over the year.


Conductive Polymer has moved upwards about 3x.


Contaminated Lorentz Fluid has move up about 9 to 10x recently.


Contaminated Nanite Compound has moved up about 2 to 3x recently.


Scorced Telemetry Processor has move up about 15x.


Tangled Power Conduit are up 10 - 12x.


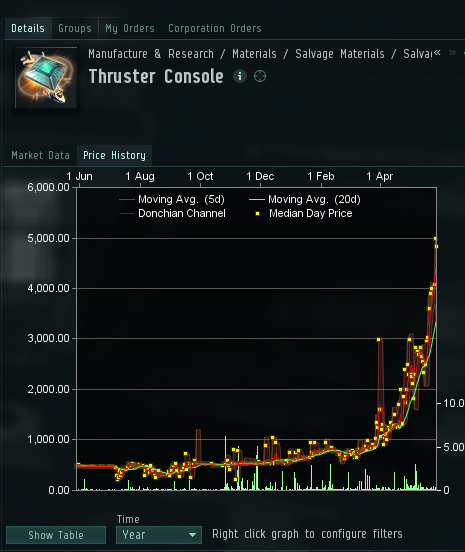
Thruster Consoles are up about 9x.


Sunday 8 May 2016

April 2016 Economic Report - the economics of war.

The monthly Economic Report for April is out.

In summary:

 - The numbers reflecting war are up; the numbers reflecting other activities are down.  This is classic war stuff - non war related activities are in decline as people resources get diverted towards the war effort; and those regions where the battles are being fought are seeing a collapse in all economic activity.

 - Deklein and Pure Blind are seeing the full effect of war

 - There is a potential that Lonetrek is becoming a new trade hub? - or at least is a key staging post for the war.

 - one or two effects seen from the Citadel release.  Expect more in May.


Overall

What we have in April are the numbers of war with the homeland of one side under siege.

General activity was lower in April with Mining down 9%, Production down 4% and Bounty Prizes down a massive 22%.

That said, the activities of war were up: Destruction rose 2%; Insurance payments rose a massive 31%; Alliance Registration fees up a massive 41%; and Corporation Registration Fees up 12%.

In amongst all this, Trade was only up 1% - so not recovered from the 14% fall during March.

There was 1 less day in April so that should have reduced everything by 3% anyway - though i suspect Easter being in March distorts matters also (not sure which way though!).

In March trading fell some 15% in all major Trade Hubs and April saw no recovery with all Trade Hubs either flat or very slightly changed.

The amount of ISK sitting in players and corporation wallets fell from 972 trillion to 968 trillion - in part due to the spending exceeding income for only the third month on record and also due to 4 trillion leaving the game (players leaving).

The overall numbers to keep everything in perspective for March, all in Trillions: Mining fell 9% to 23.0; Destruction rose 2% to 35.3; Trade rose 1% to 849.8; Production fell 4% to 104.5.


Items of note from Regional Activity

Trade


Trillions
1 The Forge 597.7
2 Domain 99.4
3 Sinq Laison 34.8
4 Heimatar 19.1
5 Lonetrek 18.6
6 Metropolis 14.0
7 The Citadel 7.1
8 Essence 6.5
9 Providence 4.4
10 Tash-Murkon 4.1

No big ranking changes from February or March.  Business almost as normal really, Trade Hubs dominating.  That said, Lonetrek has pulled further away from Hek (Metropolis).  In March it had caught up and was broadly inline, now it is clearly ahead.  Indeed, Lonetrek has a real chance of overtaking Rens (Heimatar).

It would be odd if Lonetrek was made the fifth, or indeed fourth, Trade Hub given it is a region that is right next door to Jita (The Forge).

As a reminder to new players, the main 5 Trade Hubs in the order we know: The Forge (i.e. Jita); Domain (i.e. Amarr); Sinq Laison (i.e. Dodixie); Heimatar (i.e. Rens); Metropolis (i.e. Hek).

In the next 5: the expected Essence and Tash-Murkon are there, known secondary trade hubs.  But also Lonetrek and Citadel (both Regions that are one jump out of Jita) and Providence (null sec space that borders several highsec Regions: Domain / Tash-Murkon / Devoid / Derelik).

The dominance of The Forge (Jita) reigns supreme though - Jita shows no sign of losing its dominance.


Production


Trillions
1 The Forge 19.6
2 Lonetrek 14.0
3 The Citadel 11.8
4 Domain 7.3
5 Sinq Laison 5.3
6 Providence 3.6
7 Metropolis 2.8
8 Geminate 2.5
9 Malpais 2.1
10 Tash-Murkon 2.0

In terms of Production The Forge is top slot - makes sense, many people will produce near where they buy the raw materials and/or intend to sell.  I suspect Lonetrek and The Citadel benefit from being next to The Forge and so less jumps to transport raw materials from Jita or produced items to Jita.

Domain and Sinq Laison are the other two major Trade Hubs - hence would expect Production to be there.

Deklein has fallen from the top 10 all the way to position 15 with a value fall of 61% from 4.0 trillion to 1.6 trillion.


Mining


Trillions
1 The Forge 1.7
2 Lonetrek 1.4
3 Domain 1.3
4 Providence 1.3
5 Metropolis 1.1
6 Everyshore 0.9
7 Tash-Murkon 0.8
8 Sinq Laison 0.8
9 The Citadel 0.7
10 Malpais 0.7

Some interesting items of note in mining.

Deklein, which historically had been a Top 10 mining Region has dropped out down to position number 44!  In fact, mining in Dekein has fallen 88% from 1.0 trillion to 0.1 trillion!

Otherwise, no change of note.  Tash-Murkon is back in the top 10 having fallen out in March.

The Forge and Domain at the top given being major Trade Hubs - so people mining near where they intend to sell and Lonetrek being next to The Forge and itself a major production Region.

Providence is up there given it is nullsec space that is very connected to several High Sec Regions and has a more neutral policy to neutral players.


Destruction


Trillions
1 Lonetrek 3.0
2 Pure Blind 2.3
3 The Forge 2.3
4 The Citadel 1.9
5 Black Rise 1.6
6 Domain 1.4
7 Tribute 1.1
8 Deklein 1.1
9 Metropolis 1.1
10 Sinq Laison 1.1

In March we saw Vale of the Silent enter the top 10 given a large battle.

In April we now see Deklein enter the top 10 as the battle moves to a home region.  Also, Pure Blind, another home region, storms into the number 2 position with a massive rise of 165% from 865 billion destroyed in March to 2.3 trillion destroyed in April.  In a similar vein, Lonetrek is now the number 1 slot.

War regions aside, we see that Destruction follows Trade - for that, read ganking.

For The Forge, during April there was 686 trillion ISK of goods imported into the Region and 665 trillion ISK of goods exported.  Out of all that, a mere 2.2 trillion was destroyed.  A drop in the ocean really, only 0.2% of all traffic value.  Though annoying if you happen to be amongst the drop.


In fact, all the major Trade Hubs don't see more than 0.2% of their import+export traffic destroyed in March (or February).  Ganking is clearly there but just not the threat it is made out to be.


Deklein

The numbers of a war:
  • Notable that Dekelin saw 228 trillion of exports out of the region in April vs 55 trillion Exports in March.  (Imports were 151 trillion vs 67 trillion in the prior month).  Someone was moving stuff out as quick as you like!
  • Destruction value almost tripled from 410 billion to 1.1 trillion.
  • Mining collapsed 88% from 1.0 trillion ISK to 126 billion.
  • Trade fell 35% from 2.8 trillion to 1.8 trillion ISK.
That's war for you: people leaving; trading falling; mining falling; destruction rising.


Pure Blind

The numbers of a war - almost but more interesting:
  • Pure Blind saw 211 trillion of exports out of the region in April vs 87 trillion exports in March.  However, Imports were 232 trillion vs 86 trillion in the prior month).  So, in all a balance.  Looks like someone was leaving and someone else entering.  I guess that is called a takeover!
  • Destruction value almost tripled from 865 billion to 2.3 trillion.
  • Mining collapsed 81% from 231 billion ISK to only 44 billion.
  • But Trade rose a massive 200% from 1.0 trillion to 3.0 trillion ISK.

Not sure what to read into all that other than someone has moved in big time, destroyed what was there before and is now trading aggressively - perhaps using it as a staging post.


Items of note in the Sinks and Faucets

Buying Skill books rose 21% to 11.9 trillion - which is partly recovering from the fall in March.

We can see the effect of Citadel Blueprints: the spend on Blueprints shot up 566% to 24.8 trillion vs 3.7 trillion in March.

We can also see some of the effect of the new Brokers fees with fees rising 56% to 7.5 trillion (though given the change in Broker fees was introduced at the end of April there must be other explainations).

Net insurance payments (payments to players less premiums paid to NPCs) rose by a massive 31% to 4.5 trillion ISK (on top of a massive 21% to 3.4 trillion ISK in March).  This is despite a 22% fall in bounty payments and only a 2% rise in total Destruction.  So, similar to March we are seeing a much greater use in Insurance for this current war than we have seen in normal times.  I.e. players are taking their ships to war nicely insured rather than out ratting uninsured.

On the Sinks and Faucets data there is a Sink called "Other".  Not sure what it is but in February it had an ISK inflow of 13.7 billion and an ISK outflow of 47.4 billion vs March inflow of 15.3 billion and an outflow of 51.1 billion vs April inflow of 14.1 billion and an outflow of 85.7 billion.  That said, the monthly inflows seem stable at 14 billion though the monthly outflow has almost doubled from February to 85.7 billion.  I am still not sure what this is . . . . perhaps the sum of odds and ends.

Project Discovery fell 12% from 340 billion of ISK to 298 billion.


Items of note in the Money Supply

The greatest inflow of ISK into the game as a % of the prior day's ISK was on 17 October 2014 when 4.9 trillion ISK came into the game (=0.66% of the prior day's ISK in the game).  And indeed 18 October 2014 was the third largest day with 4.1 trillion ISK coming into the game.  Not sure why this would be: Plex went over 800m though that itself would not cause ISK to flow into the game; may also relate to SOMER Blink reimbursing prior deposits (see paragraph below).

That said, in April we had a new top 10 day % inflow when on 1 April 2016 3.8 trillion ISK was generated = 0.39% of the prior day total ISK.

The greatest outflow of ISK from the game occured on 20 August 2014 when a massive 32.7 trillion ISK left the game (=4.3% of the prior day's ISK in the game).  Most likely to do with the banning of SOMER Blink from the game on that day.  To put this in perspective, the next largest outflow of ISK was on 8 January 2016 when 4.8 trillion left the game (=0.52% of the prior day's ISK in the game) - again, most likely due to a banning event: The Latest IWANTISK Ban Wave.  Seems at least to be a pattern to the major outflow days = banning days.

That said, in April we had two new top 10 % outflow days.  27 April was the second greatest % outflow (at 11.6 trillion) and 28 April was the third greatest % outflow (at 5.5 trillion).  I suspect we can map those two days directly onto the 24.8 trillion spend on Blueprints in April (vs the normal 3 - 4 trillion) as Citadel Blueprints were purchased.


Items of note in Imports and Exports

As we would expect the major 5 Trade Hubs and the Regions next to them see the greatest Imports and Exports.  No surprise there, all traffic heading for Jita / Amarr / Dodixie / Hek / Rens.

Looking for some notable items:

  • Deklein and Pure Blind, as noted above, saw large increases in Imports and Exports in April
  • Continuing the trend seen in March, Branch saw a big rise in both imports and Exports.  If i follow the rise in Imports and Exports from connecting Regions then the trail would suggest these imports and exports were coming and going from Venal (not Deklein or Tenal) which in turn looks like it came from Tribute (not Perrigen Falls).  From there it was imported and exported to Lonetrek (and so some onto The Forge).
  • Looking closer at Branch - mining collapsed by 88%; Destruction rose by 13% on top of the March rise of 33%; Trading collapsed by 29%; and Production collpased by 85%.  Branch is right next to Deklein, so likely caught up in the war!

The following look to be war related:
  • Black rise saw an abnormal rise in Imports and Exports - no doubt war related given the position of the region.
  • Essense rise saw an abnormal rise in Imports and Exports - again, war related given the position of the region.
  • Placid rise saw an abnormal rise in Imports and Exports - war related given the position of the region.
  • Tenal rise saw an abnormal rise in Imports - war related given the position of the region.
  • Venal rise saw an abnormal rise in Imports and Exports - war related given the position of the region.

Not sure about these two:
  • Curse rise saw an abnormal rise in Imports and Exports - not sure why that would be.
  • Derelik rise saw an abnormal rise in Imports and Exports, though trading fell 26% - not sure why that would be but i suspect related to Curse given those Regions are next to each other.

Citadels

Only seen two effects so far:

Firstly, the spend on Blueprints rose a massive 566% from 3.7 trillion ISK to 24.8 trillion ISK.

Secondly, the price of Plex fell.  I greatly suspect players and Corporations are selling surplus Plex to fund the cost of the new Citadels - and perhaps the cost of the war.